Agencies do not fail at web performance because they lack Lighthouse. They fail because portfolio monitoring turns into unpaid operations work: one Lighthouse run per client repository, slide decks rebuilt from JSON before every retainer call, and regressions on /checkout that never lived in the CI URL list.
That is the problem we set out to solve with Apogee Watcher — a multi-tenant PageSpeed Insights and Core Web Vitals monitoring platform for digital agencies, freelancers, and in-house teams who manage many sites. This is a build story, not a feature dump: what broke at scale, what we chose to own, and what we still refuse to over-claim.
The tipping point: CI that protects merges, not portfolios
Lighthouse CI is the right first tool. It answers a precise question: did this build pass the thresholds we configured on the preview URLs we listed? Agencies adopt it for merge protection, reproducible lab numbers, and zero SaaS invoice while the portfolio is small.
The friction rarely appears on client one. It appears around client five to fifteen. Each repository drifts (different Lighthouse versions, different assertions, different preview hosts). Flaky runners train teams to re-run until green or mute the job. Field drift and Chrome User Experience Report (CrUX) movement sit outside the pipeline entirely. Account managers still need a narrative sponsors can read — not terminal artefacts.
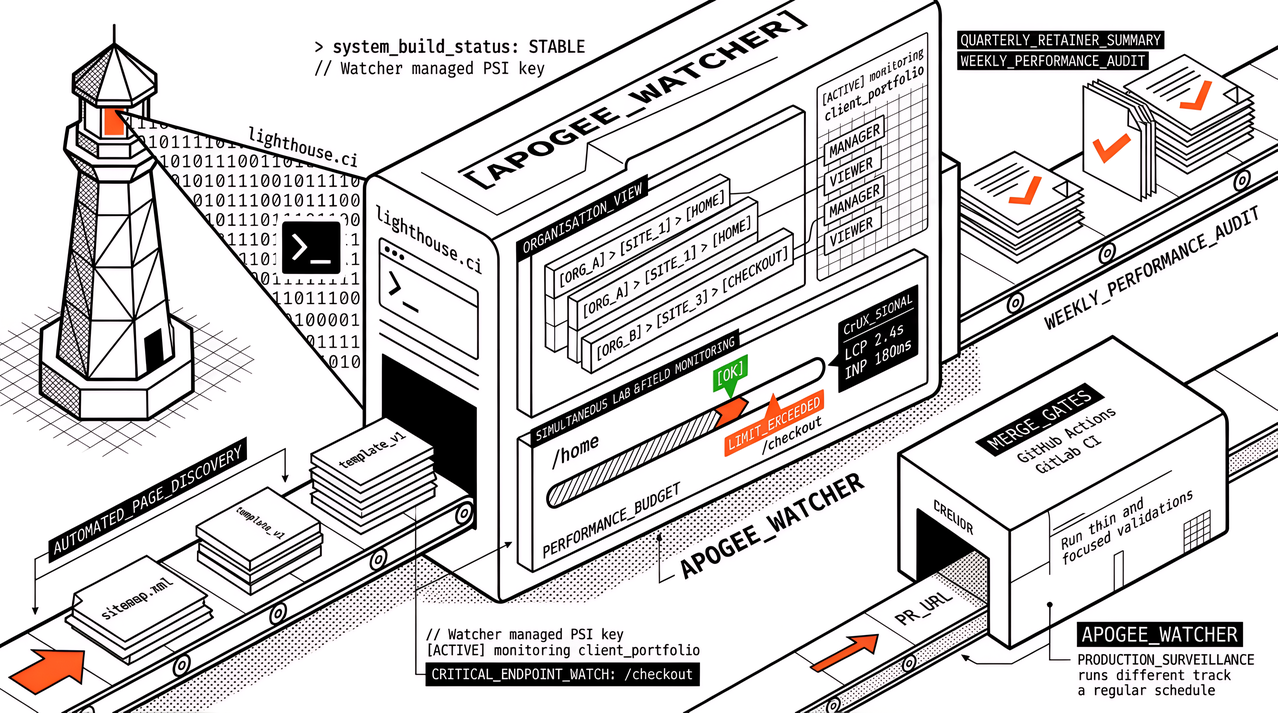
In our writing and product work through 2026, we kept a hard split: keep Lighthouse CI thin for merge gates; put production surveillance on a schedule. Trying to make CI do both produces either huge workflows or neglected configurations. Watcher is the managed layer for the second job. It is designed to layer beside your stack, not replace Git, your CMS, or existing CI gates.

Product decisions we treated as non-negotiable
1. Organisations first, not a flat project list
Watcher is organised as organisations → sites → pages, with Admin, Manager, and Viewer roles. Competitors often ship flat project lists or basic team seats. Agencies need client isolation and read-only client access without exposing configuration. Multi-tenant structure was a day-one requirement, not a later enterprise add-on.
2. Automated page discovery
Manual URL entry does not survive onboarding a client with hundreds of templates. Watcher parses sitemap.xml (and sitemap indexes), respects priority and changefreq where present, and can fall back to same-domain HTML crawl with depth and filters. Pages sync as the sitemap changes. Manual add and exclude remain available for edge cases.
3. Lab and field in every scheduled test
Every run goes through Google PageSpeed Insights. You get Lighthouse lab metrics and CrUX field data when the origin has enough traffic — Largest Contentful Paint (LCP), Interaction to Next Paint (INP), Cumulative Layout Shift (CLS), plus FCP, TBT, Speed Index, and performance score, on mobile and desktop. Agencies need both: a stable lab baseline and the real-user signal Google actually uses for experience.
4. No per-client PageSpeed Insights API keys
Per-site tools and DIY scripts force agencies to juggle keys and quotas. Watcher holds the PageSpeed Insights relationship. You add sites and schedules; you do not operate a key farm. Site-based quotas and agency tiers are meant to match retainer economics better than surprise per-domain line items.
5. Budgets and cooldowns before “more channels”
Performance budgets define green and red (for example, LCP ≤ 2.5s, CLS ≤ 0.1). When a metric breaches a budget, an alert fires. Smart cooldowns stop repeat noise until the metric recovers. Email alerts are live today; Slack and webhook delivery are on the roadmap — we state that plainly rather than implying a full incident stack we have not shipped.
6. Clean, helpful reports — not JSON dumps
Retainer work lives or dies on whether sponsors can read the evidence. We provide white-label web performance reports that prioritise clarity: weekly organisation portfolio PDFs on a Sunday schedule, with Preview for the current week, and white-label logo, colour, and font on plans that include branding. For attention-free check-ins, a score and domain report summary packages the signal without forcing another slide rebuild. Monthly and custom date-range organisation report types remain reserved, not self-serve yet — we state that rather than implying a full reporting suite we have not shipped.
What the last six months of shipping looked like
Across the Watcher blog from early 2026 through September, the public trail matches how we actually build:
Build versus buy clarity — published guidance that agencies should keep CI for merges and add managed monitoring for portfolio schedules, CrUX drift, alerts, and client evidence.
Retainer workflow before polish — scheduled tests and budgets as the evidence spine; narrative and branded PDF as the packaging layer, not the other way round.
Honest report roadmap — weekly organisation portfolio PDFs on a Sunday schedule, with Preview for the current week, and white-label logo/colour/font on plans that include it. Monthly and custom date-range organisation report types remain reserved, not self-serve yet.
Operational honesty — posts on Cloudflare challenges blocking PageSpeed Insights automation, cache headers that survive deploys, and late versus early CLS, because monitoring that ignores edge and lab quirks lies to the client.
Segment benchmarks — Magento, Shopify, and fashion store Core Web Vitals samples drawn from Watcher-led cohorts, used to teach triage rather than invent vanity averages.
None of that requires first-party RUM. Watcher is monitoring-first: PageSpeed Insights lab plus CrUX. Where a client already runs specialised real-user monitoring, we still say “layer, don’t replace.”
Under the hood, we care about reliability of scheduled collection, historical retention by plan, and exportability — encrypted in transit and at rest, GDPR-minded practices, data export without lock-in. Apogee Information Systems has built information systems since 2002; Watcher inherits that long-term bias. There is no VC pressure to inflate the roadmap.
Included today and next steps
Included for teams evaluating Watcher now
Multi-tenant organisations with role-based access
Automated sitemap/crawl discovery
Scheduled PageSpeed Insights tests with lab + CrUX when available
Performance budgets and email alerts with cooldowns
PDF reports; white-label branding on eligible plans
Weekly organisation portfolio reports (Sunday schedule + week Preview)
Attention-free score and domain report summaries
Under development
Self-serve monthly / custom-range organisation report types
Slack and webhook alert delivery
A fully public, stable agency HTTP API (in active development; CI should still use Lighthouse CI for merge gates until reference docs land)
Who it is for
If you manually open PageSpeed Insights for more than a handful of clients, or if Lighthouse CI maintenance already competes with billable delivery, you are in the audience. Typical fit is agencies and freelancers managing roughly 10–50+ sites who need portfolio schedules, budgets, and client-ready evidence without enterprise RUM pricing.
If you only need a hard merge gate on one preview URL, stay on Lighthouse CI. If you need deep single-app RUM, keep SpeedCurve-class tooling where it already earns its keep. Watcher sits in the agency portfolio gap: monitoring-first, multi-tenant, agency-shaped pricing, lab plus field without per-client API key theatre.
Try the product
Apogee Watcher is now available at apogeewatcher.com. Start with a free account, add a few high-value client domains first, set budgets you would defend in a quarterly review, and keep your existing CI gates. The goal is simple: pay attention only when a metric crosses a line you already agreed on — and hand sponsors a report that looks like it came from your agency, not from a weekend export.